Iterate AI
Jan 21, 2025
Metrics vs. Analytics: How Are They Different?
Terms like “metrics” and “analytics” often come up in discussions about product performance. Honestly, some people use these terms interchangeably but they are different. Understanding the difference is important for product managers.
While they’re interconnected, metrics and analytics serve distinct purposes in the product management ecosystem. This blog unpacks these concepts along with when and where to use them.
What Are Metrics?
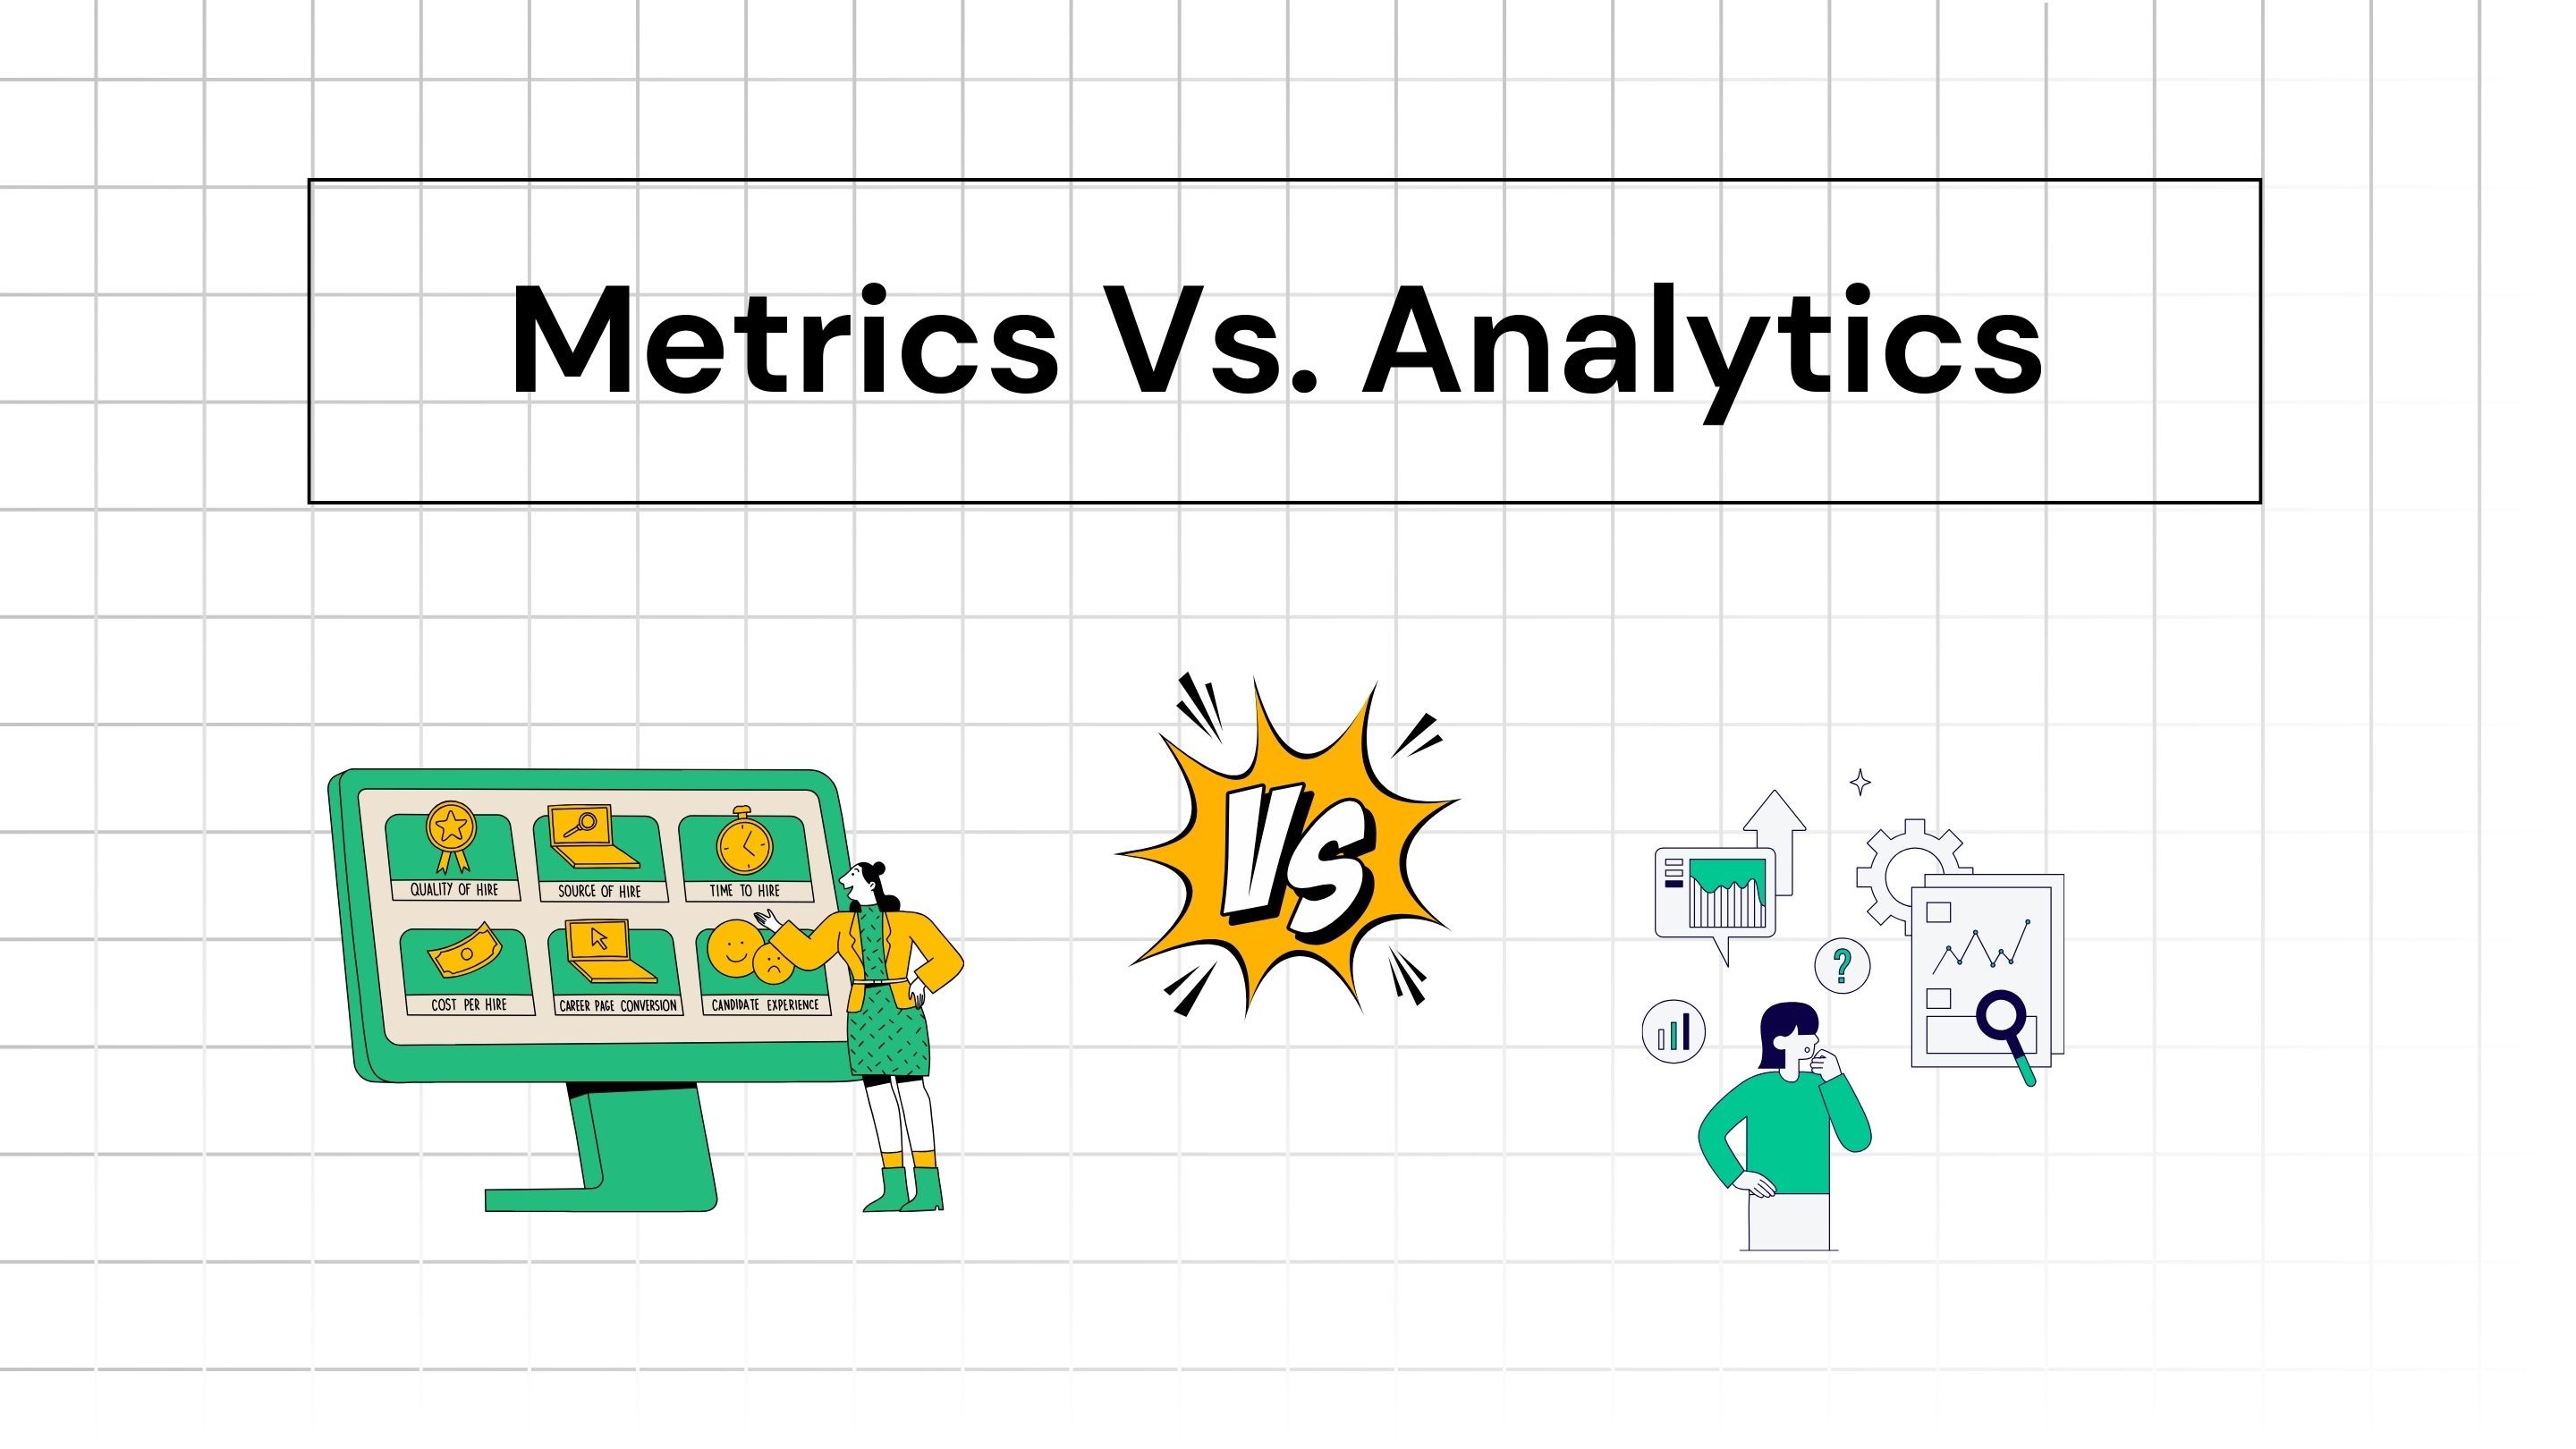
Metrics are the quantifiable measures that indicate the performance of a product, team, or business. In a product app, they’re the “what” — raw numbers or data points that provide a snapshot of performance at a given moment. For example, your dashboard might show 10 Active Users which is the metric.
Metrics answer straightforward questions: How many users signed up last month? What is our churn rate? They’re vital for tracking progress and setting benchmarks.
Types of Product Metrics
Here are the common types of metrics and some examples under each type.
Customer metrics
These metrics focus on understanding user behavior, engagement, and satisfaction.
Customer Acquisition Cost (CAC)
Customer Lifetime Value (CLV or LTV)
Customer Churn Rate
Net Promoter Score (NPS)
Revenue metrics
These metrics track the financial health and revenue streams of a SaaS business.
Monthly Recurring Revenue (MRR)
Annual Recurring Revenue (ARR)
Average Revenue Per User (ARPU)
Expansion Revenue
Gross Margin
Product usage metrics
These metrics help track how customers interact with the product.
Daily Active Users (DAU)
Monthly Active Users (MAU)
Session Duration
User Retention Cohorts
Time to Value (TTV)
Operational metrics
These metrics assess the efficiency and effectiveness of business operations.
Burn Rate
Lead-to-Customer Conversion Rate
Sales Cycle Length
Support Tickets Per User
Growth metrics
These metrics focus on evaluating and driving business expansion.
Revenue Growth Rate
Net Revenue Retention (NRR)
Customer Acquisition Growth Rate
Virality or Referral Rate
Market and competitive metrics
These metrics help understand market position and competitive dynamics.
Market Share
Competitor Benchmarks
Custom metrics and advanced analytics
These are tailored metrics or deep data analyses that cater to specific business needs.
Customer Health Score
Cohort Analysis
Predictive Analytics
Good to Know These About Metrics
Here are a few things to remember:
Keep metrics aligned with goals
Ensure the metrics you track are directly tied to your product’s objectives. Avoid vanity metrics that don’t drive actionable insights.
Ensure reliability
Set up your product data analytics with the right planning and scalability in mind. Plan all events and come up with a label structure. This way, you can be sure that the data is captured correctly.
💡 Setting up analytics can be difficult for PMs when they have to depend on developers to write code. With Iterate AI, PMs can just click on user actions in the app to create events and get the code to implement themselves. This lessens dependency and makes setting up analytics faster. Learn how.
Use a balanced metric framework
Combine leading indicators (predictive metrics like sign-up rates) and lagging indicators (retrospective metrics like revenue) to get a holistic view.
Regularly review and update metrics
Reassess metrics as your product evolves. What’s important during a launch may differ from what’s critical during a scaling phase. Revamp your dashboard also accordingly.
Visualize metrics clearly
It is difficult to make sense of data without visuals. Use dashboards or visual tools to make data easily understandable for stakeholders.
What Is Analytics?
Analytics is the process of interpreting data to extract actionable insights. It’s the “why” — the investigation behind the numbers. It is a way to turn data into a story.
Analytics involves analyzing trends, correlations of multiple metrics, and patterns to understand to find insights or find logic behind observed results.
How analytics adds value:
Understanding behavior:
Why are users abandoning their carts?
What features drive the highest engagement?
Optimizing processes:
How can we reduce the time from onboarding to first purchase?
What pricing model maximizes conversions?
Identifying opportunities:
Which untapped user segments show growth potential?
What unmet needs can we address with new features?
Good to Know These About Analytics
Here are a few things to remember:
Ask the right questions
Start with clear hypotheses or questions. For example, instead of asking, “Why is churn high?” ask, “What user behaviors correlate with high churn?”
Segment data effectively
Break down data by user segments, periods, geographies, company size, age, etc. to uncover deeper insights. Co-relate data to see patterns.
Prioritize actionable insights
Focus on insights that can drive meaningful changes, rather than overanalyzing inconsequential trends.
Collaborate with experts
Partner with data scientists or analysts to refine methodologies and ensure accurate interpretations. Sometimes you are too close to data to find insights.
Test and Iterate
Use A/B testing or experimentation to validate insights and apply learnings iteratively. Sometimes, data-based insights can be too quantitative. Doing beta testing or releasing in phases helps you test the waters before going all in.
The Relationship Between Metrics and Analytics
Think of metrics as the “dots” and analytics as the process of “connecting the dots.” Metrics give you the raw data points, while analytics helps you interpret them to form a comprehensive picture. For example:
Metric: Churn rate is 10%.
Analytics: Analyzing churn rates with different company sizes reveals that enterprise-size customers contribute more to churn as the product does not scale with their needs.
By combining both, you can identify problems, and implement solutions.
